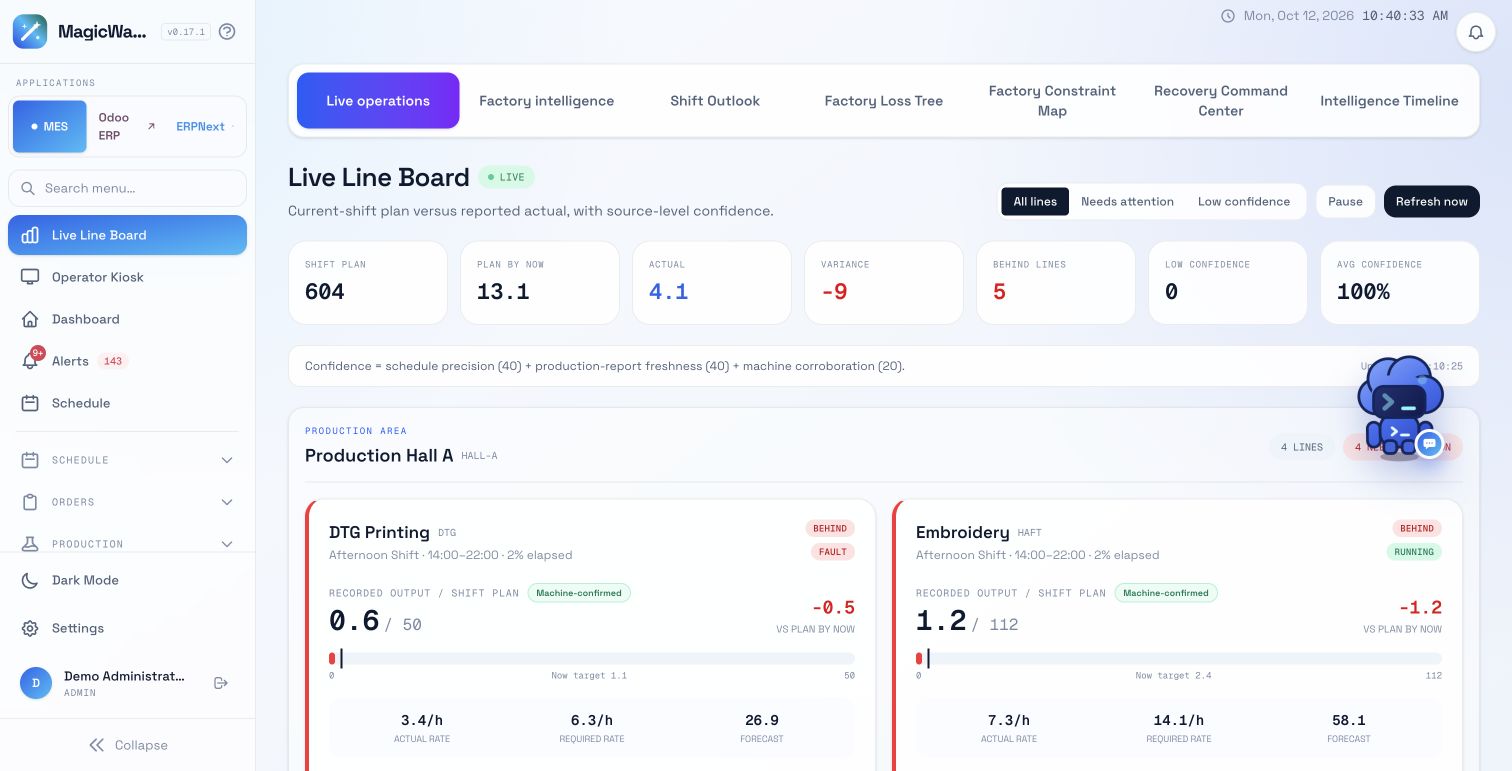
Production monitoring that keeps the shift in view.
Follow output against the plan across your production lines. Give supervisors one place to see progress, open issues and the evidence behind the numbers.
Actual MagicWand product screen · demo data · click to enlarge
01 / PRODUCTION MONITORING
Compare the plan with what is happening
A machine can be running while the line falls behind its commitment. The Live Line Board compares reported output with the total shift plan and the target by now. Actual and required rates give the team a starting point for deciding where attention is needed.
In a product walkthrough
Start with a line behind plan. Review its actual output, shift target and related work orders together before choosing a response.
02 / PRODUCTION MONITORING
Keep the issue beside the work
Machine state, current jobs and open issues appear in the line context. Instead of treating a production number as an isolated metric, inspect the work order and the conditions around it. Material coverage, workforce readiness and quality exposure help guide the next question.
In a product walkthrough
Move from the line to its supporting records. Check whether the problem concerns the machine, a material constraint, an open issue or work outside the current-shift schedule.
03 / PRODUCTION MONITORING
Inspect the source before acting
The board shows source-level confidence and report freshness. It distinguishes machine-confirmed, operator-confirmed and quality-unverified output. Connector health provides another view of stale sources and connection problems, so supervisors can review the basis of the operational picture.
In a product walkthrough
Use confidence as context for the displayed figures. Review source freshness and the appropriate records when a decision depends on the latest production position.
PRACTICAL QUESTIONS
Before your product walkthrough.
What does the line board show?
Shift targets, reported actual output, machine status, current work orders, open issues and source confidence. It also connects the current position to the line outlook and readiness evidence.
Does every machine need a new sensor?
The connection approach depends on your equipment and available data sources. Review controllers, production reporting and required update frequency during a walkthrough.
How is monitoring different from forecasting?
Monitoring explains the current production position. Shift forecasting estimates possible shift-end results and shows uncertainty, shortfalls and recovery context.